
Report with Graph Template
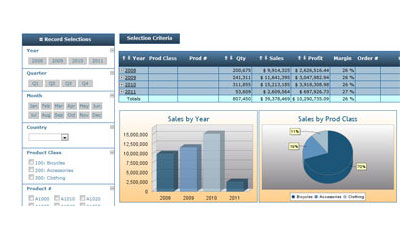
This template creates Reporting/Business Intelligence applications, complete with a run-time prompt page for self-service reporting. The built-in interactive graphs/charts let users click on graph values and drill down to more information. Here are a few more features of this template:
- Automatically creates smartphone and tablet application versions.
- Included prompt page lets users filter data and choose levels of output (detail, subtotal levels, grand total level) at run-time.
- Lets users email reports or export reports in multiple formats (HTML, PDF, Excel, CSV, XML, TSV, more) straight from the browser.
- Create bar, line, pie, or speedometer charts and use the graph values as drill-downs.

The prompted report template creates flexible reporting applications quickly. Here are just a few types of applications often built with this template:
Drill down reports
Business Dashboards
Ad-hoc reporting
m-Power templates offer even more capabilities when combined. Here are a few ways other m-Power templates are often used to enhance the report with graph template:

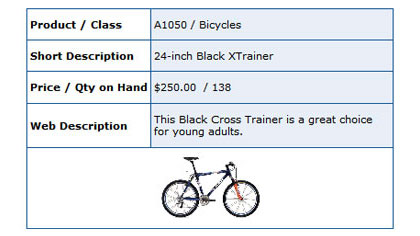
Single-record inquiry
Let users drill down and view more details for any record using the single record inquiry template.

Interactive Reports
Embedding interactive reports into a report with graph application creates powerful interactive dashboards.

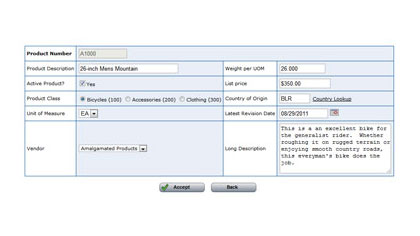
Single Record Maintenance Template
Embedding a report with graph application into a single record maintenance application creates product update applications complete with sales history.
Learn how m-Power can help you
Sign up for a free trial
