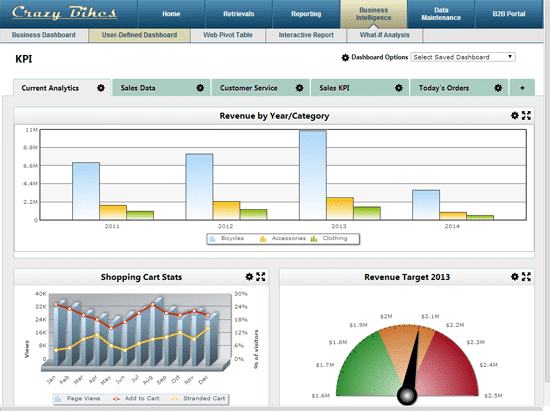
 Summary: Typical dashboards are inflexible–displaying a pre-determined set of metrics in a pre-set layout. Learn how user-defined dashboards fix this problem, and could save your IT department hours of time.
Today, let’s explain a type of web dashboard that could be an important tool in any company’s Business Intelligence repertoire: the user-defined dashboard. What is it, why is it important, and how does it help your company?
The user-defined dashboard is a business dashboard that individual users control and customize. Every user controls the data they wish to see as well as the dashboard’s structure and layout. In short, a single user-defined dashboard can display different data to every user.
Why use a user-defined dashboard?
A powerful reporting and BI tool, dashboards combine essential business metrics together on a single page. They provide a live overview of business operations and help business leaders make quick, informed decisions.
Typical dashboards usually display a pre-determined set of metrics in a pre-set layout. For instance, a sales dashboard might display metrics like daily/monthly product sales, geographical sales numbers, top customers, and salesperson performance, to name a few. If one sales manager needed additional metrics, or metrics that differ from the other sales manager’s dashboards, they run into problems. They must either create a brand new dashboard themselves, or request a new dashboard from the IT department.
The user-defined dashboard fixes this problem. It lets the IT department create a single dashboard and lets each user customize their data as necessary. It’s the best of both worlds: Users get their own customizable dashboards, and IT isn’t constantly creating different dashboards for different users.

How are user-defined dashboards used?
User-defined dashboards are used like regular dashboards, only with more customization options. For instance, a user-defined dashboard may show:
- Website conversion metrics: Dashboards are often used by the marketing team to track website conversions. They help marketers understand which search terms and pages generate the most leads, and which areas need help.
- Real-time product sales: Real-time dashboards let business leaders view product sales statistics as they happen. Real-time dashboards also can alert business leaders to problems as they happen, which lets them fix these issues before they get out of hand.
- Warehouse/Shipment details: Dashboards are also used to track warehouse efficiency and shipments. A dashboard can tell the warehouse manager if orders are being fulfilled on time and whether or not shipments are running on schedule.
Demo of a user-defined dashboard
Here’s a great demo of a user-defined dashboard in action. Feel free to adjust the layout or data displayed on the dashboard as needed. If you’d like to learn more about the capabilities found in the user-defined dashboard, check out this video:
Of course, if you’d like to learn how to create user-defined dashboards for your company, let us know. Just fill out this short form and tell us what you’d like to accomplish.
Pingback: Productivity Dashboard | Search Results Web results World News, Latest World News, Breaking News
Pingback: Productivity Dashboard | Search Results Web results World News, Latest World News, Breaking News
Pingback: What Are Dashboards In Excel? – Almazrestaurant