
Updated September 2026 with industry examples, a comparison with dashboards, a section on AI, and an FAQ.
 Today, let’s explain an important type of web report that could be a useful addition to any company’s reporting repertoire: the ranking report (also known as “the top N report”). What is it, why is it important, and how does it help your company? Let me explain.
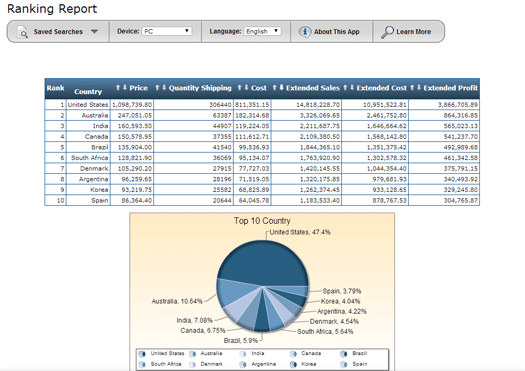
The ranking (or top N) report creates variable rankings, across multiple dimensions, while specifying various selection criteria at run-time. In short, it lets you rank any aspect of your data from best to worst, or vice-versa. It lets users choose from a number of different criteria at run-time, and then instantly run a top/bottom ranking report complete with a graph.
Why use a ranking report?
Ranking reports are simple, yet powerful end-user reporting tools. An IT department can create a single ranking report, include the necessary selection criteria (like product sales, customer info, sales data, etc..), and turn it over to the end users. Based on their desired selection criteria, end users can easily generate top/bottom ranking reports for different aspects of the business.
How are ranking reports used?
As the name implies, this reporting type delivers top-N style rankings. For example, businesses use ranking reports to:
- Rank their most profitable products over a select time-frame
- Understand their best and worst performing salespeople
- View their top/bottom retail locations over the past year
- and more
Going one step further, some even combine ranking reports with multi-tenancy. This lets multiple user levels access the same ranking report, but only view the data they’re authorized to view. This approach lets the IT department create just one ranking report, and distribute to all user levels.
Ranking report demo
Here’s a great demo of a ranking report in action. Select from the criteria, click “Run Report,” and you’re all done!
5 Industry Examples of Ranking Reports
Ranking reports work across most industries. Here are five concrete examples that show why this report type is so versatile.
1. Manufacturing: Top 10 Defective Parts by Cost
A quality manager selects a date range and ranks parts by total defect cost. The report instantly shows which components are driving the most waste, so the team can prioritize supplier reviews or process changes.
2. Healthcare: Bottom 5 Departments by Patient Satisfaction Score
Hospital administrators rank departments by patient satisfaction over the past quarter. Instead of sifting through spreadsheets, they see the lowest-performing departments at a glance and can drill into the data to understand why.
3. Retail: Top 20 Products by Revenue (by Region)
A regional sales director runs a ranking report filtered by their territory. They see their top-selling products, compare against the prior period, and adjust inventory or promotional spending accordingly.
4. Distribution: Bottom 10 Customers by Profit Margin
A CFO ranks customers by profit margin to identify accounts that generate revenue but cost more to serve than they return. This data drives pricing conversations and contract renegotiations.
5. Financial Services: Top 15 Loan Officers by Approval Rate
A branch manager ranks loan officers by approval-to-application ratio. High performers are identified for mentoring roles. Officers with unusually low or high rates are flagged for review.
Ranking Reports vs. Dashboards: When to Use Each
Ranking reports and dashboards do different jobs.
- Dashboards give a broad, at-a-glance view of multiple KPIs at once. They’re built for monitoring. A dashboard might show you that revenue is down, but it won’t tell you which products or regions are responsible.
- Ranking reports answer a specific question: “What are the top (or bottom) performers across a given dimension?” They let users change the criteria at run-time, so a single report can answer dozens of different questions.
The most effective reporting strategy uses both. Dashboards for daily monitoring. Ranking reports for the follow-up analysis when a number looks off.
How AI Is Changing Ranking Reports in 2026
Traditional ranking reports require the user to choose what to rank and how. In 2026, AI adds automated anomaly detection on top. Instead of waiting for a manager to run a “bottom 10” report, an AI-enhanced system can proactively flag when a product, location, or employee falls outside expected ranges.
What matters is governance. AI-driven alerts are only useful if they run over accurate, governed data. If your ranking reports pull from ungoverned spreadsheets or siloed systems, AI amplifies the problem instead of solving it. It needs clean data in a real database, with access that IT controls.
How to Build Ranking Reports with m-Power
m-Power is mrc’s low-code development platform. It runs directly over a company’s existing databases, so an IT team can build ranking reports, dashboards, and AI tools without migrating data. Here’s what building a ranking report looks like:
- Connect to your database. m-Power runs directly over DB2, SQL Server, MySQL, Oracle, and PostgreSQL. No data extraction or migration is needed.
- Select your ranking criteria. Using a point-and-click interface, choose the fields users can rank by (product, region, salesperson, time period, etc.).
- Set run-time parameters. Let users choose how many results to display (Top 5, Top 10, Top 50) and the sort direction (best to worst or worst to best) at run-time.
- Add charts and graphs. m-Power generates interactive charts alongside the tabular data, so users get both the numbers and the visual story.
- Apply security. Use row-level security so each user only sees the data they are authorized to access. One report serves every role in the organization.
The build takes minutes. And because m-Power is sold as a perpetual license with unlimited users, you can give ranking reports to every department without adding per-user costs.
John Perrin, CIO at Farner-Bocken, put it this way: “Easily the best technology investment I’ve made in my 20+ year career.”
Want to see it in action? Request a demo and we will build a ranking report over your own data so you can see how it works in your environment.
Frequently Asked Questions
What is the difference between a ranking report and a sorted list?
A sorted list displays every record in order. A ranking report limits the results to the top or bottom N records based on user-selected criteria, and typically includes a chart. The ranking report is meant for quick analysis rather than reviewing every row.
Can non-technical users run ranking reports on their own?
Yes, if the report is built correctly. The IT department creates the report and defines the available criteria. End users then select what they want to rank, choose how many results to display, and run the report themselves. No technical knowledge is needed.
How are ranking reports different from dashboards?
Dashboards provide a high-level view of multiple metrics at once. Ranking reports answer a specific question: “What are the top or bottom performers in this area?” Dashboards are for monitoring. Ranking reports are for targeted analysis. Most organizations benefit from using both together.