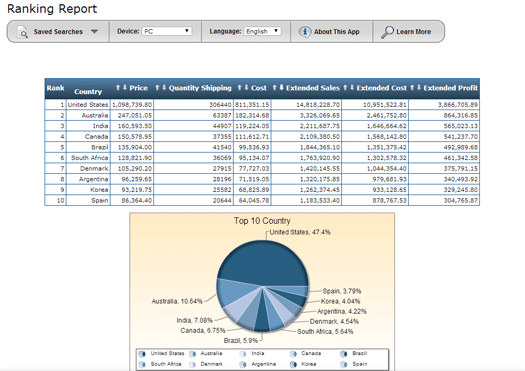
 Today, let’s explain an important type of web report that could be a useful addition to any company’s reporting repertoire: the ranking report (also known as “the top N report”). What is it, why is it important, and how does it help your company? Let me explain.
The ranking (or top N) report creates variable rankings, across multiple dimensions, while specifying various selection criteria at run-time. In short, it lets you rank any aspect of your data from best to worst, or vice-versa. It lets users choose from a number of different criteria at run-time, and then instantly run a top/bottom ranking report complete with a graph.
Why use a ranking report?
Ranking reports are simple, yet powerful end-user reporting tools. An IT department can create a single ranking report, include the necessary selection criteria (like product sales, customer info, sales data, etc..), and turn it over to the end users. Based on their desired selection criteria, end users can easily generate top/bottom ranking reports for different aspects of the business.

How are ranking reports used?
As the name implies, this reporting type delivers top-N style rankings. For example, businesses use ranking reports to:
- Rank their most profitable products over a select time-frame
- Understand their best and worst performing salespeople
- View their top/bottom retail locations over the past year
- and so much more…
Going one step further, some even combine ranking reports with multi-tenancy. This lets multiple user levels access the same ranking report, but only view the data they’re authorized to view. This approach lets the IT department create just one ranking report, and distribute to all user levels.
Ranking report demo
Here’s a great demo of a ranking report in action. Select from the criteria, click “Run Report,” and you’re all done!
Of course, if you’d like to learn how to create ranking reports for your company, let us know. Just fill out this short form and tell us what you’d like to accomplish.