Overview
This document will provide an overview on building charts in the latest m-Painter and within the dashboarding utility. Several key features of m-Power’s charting capabilities include:
- The ability to source your chart data from an m-Power application or a Data Model.
- Integration of the charting UI in m-Painter editor, allowing developers to create a chart inside any application of their choosing (Retrieval, Report, Maintainer) as they customize the app’s presentation.
- Integration of the charting UI in m-Power’s dashboarding utility, providing developers a more streamlined process when creating and configuring charts for their dashboard.
- Real-time previews of the chart data and output during the chart creation.
- Utilization of the Apache Echarts library, allowing developers to implement a wide array of customizations to their charts.
Inserting a chart…
Charts may be inserted into the m-Power application or a m-Power dashboard. Both methods are shown below:
…In a m-Power application
For developers wanting to insert a chart into an application, this is done via the m-Painter editor.
Inside m-Painter, first click inside the space you have created for your graph and then click the “Chart” option within the Featured Components menu to open the Chart UI:
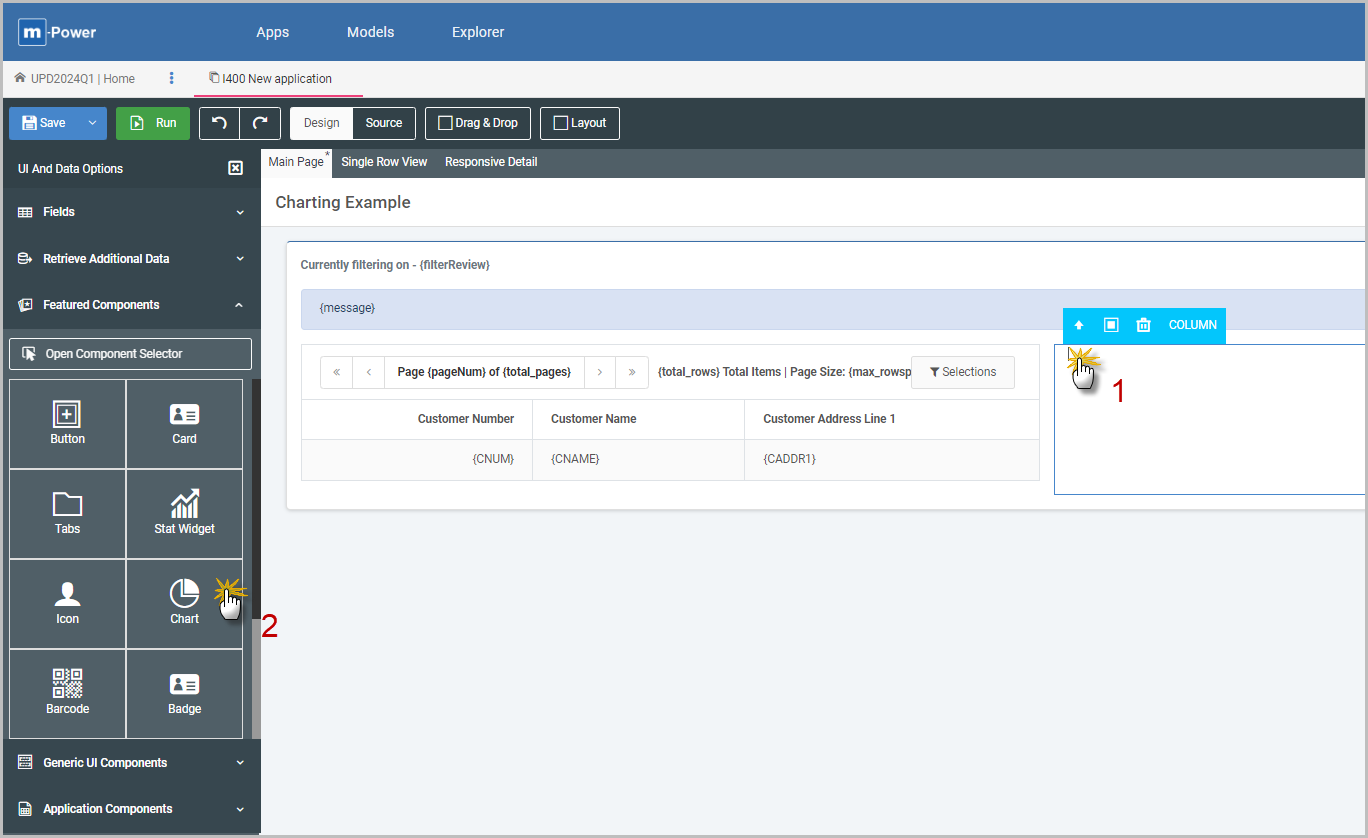
From this point forward, please proceed to the “Using the Chart UI” section for learning about the different options and configurations for charts.
…Into a m-Power dashboard
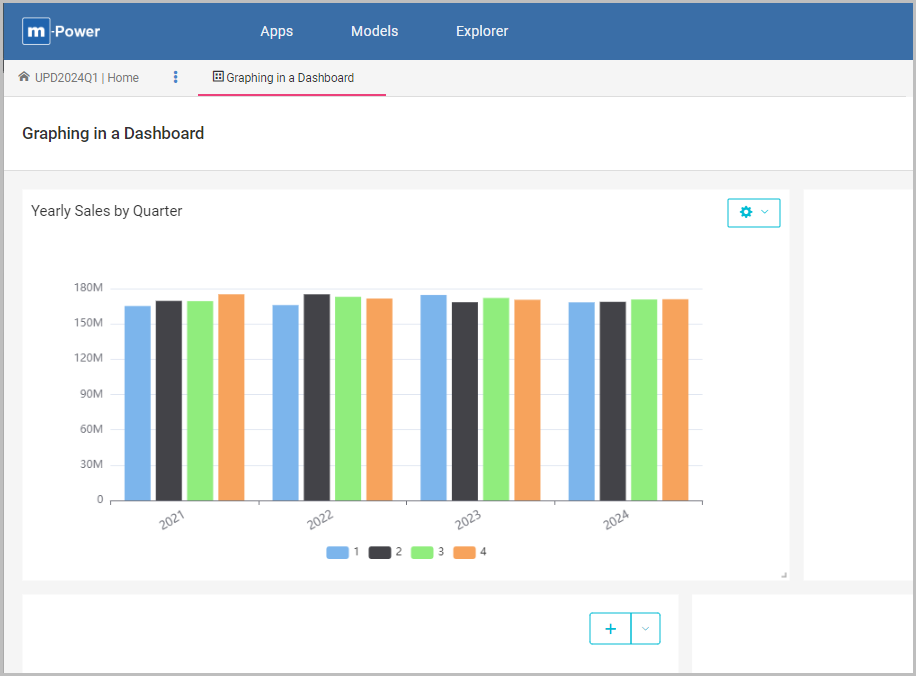
As opposed to inserting a chart into an application, this section will show how developers can insert charts into an existing dashboard.
Run the existing dashboard and press the plus icon on a blank portlet within the dashboard:
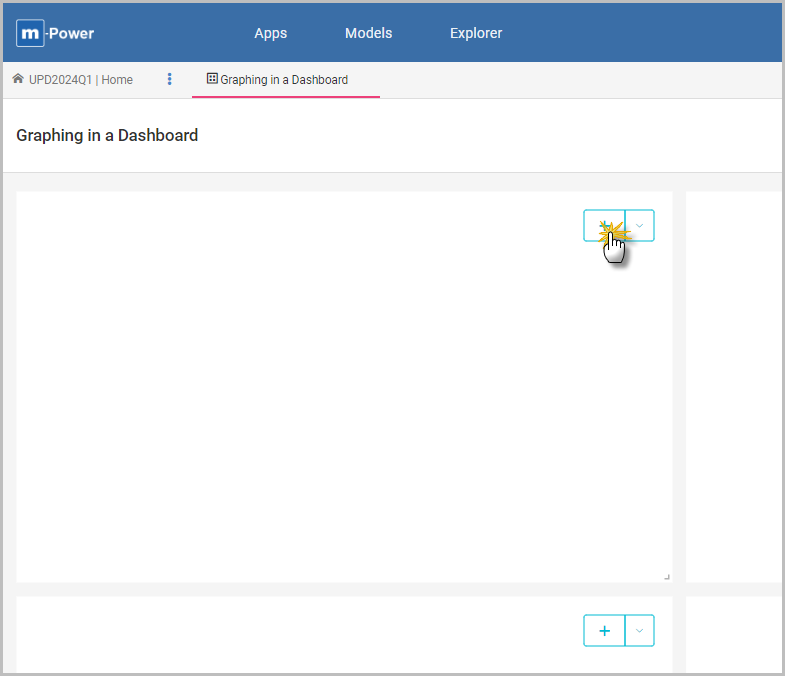
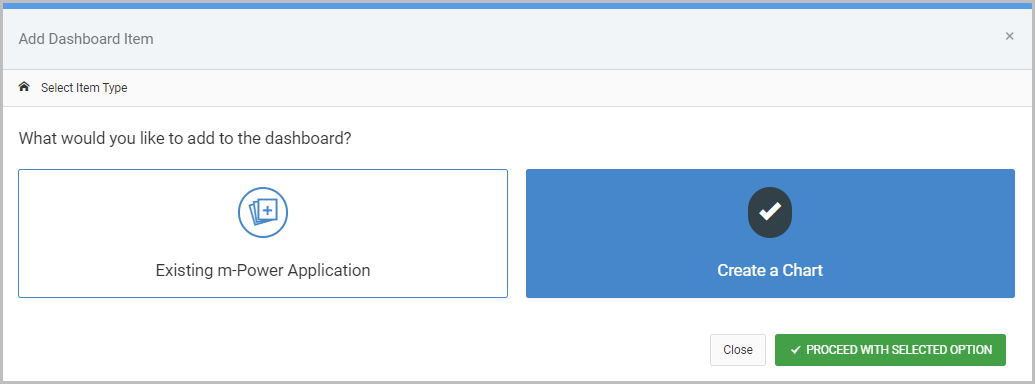
In the ‘Add Dashboard Item’ screen, select the option to “Create a Chart”:
From this point forward, please proceed to the “Using the Chart UI” section for learning about the different options and configurations for charts.
Using the Chart UI
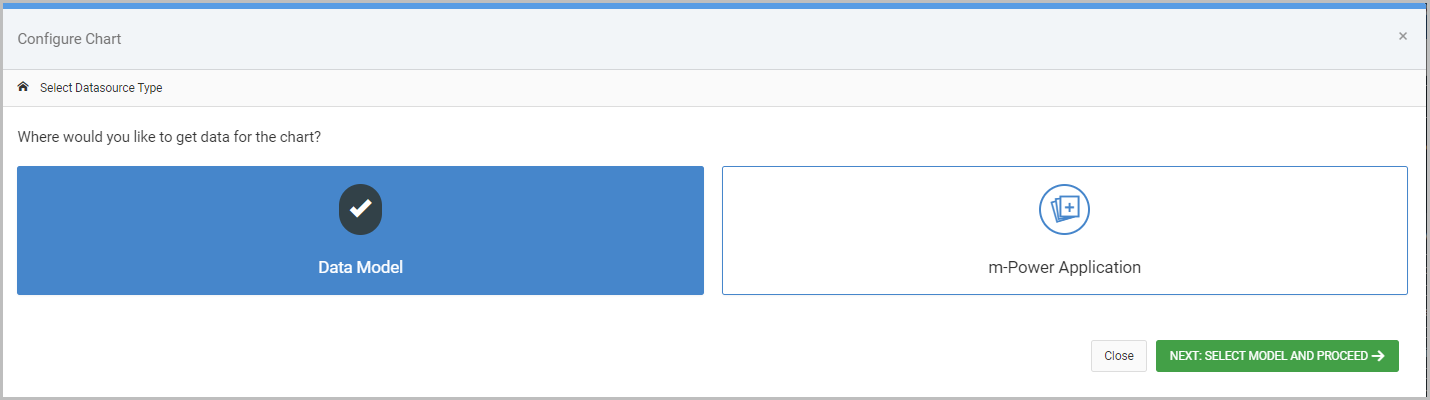
The first option of the chart UI will be to specify the chart’s data source, as shown in Figure 6. The data must be sourced from either an m-Power application or Data Model. This example will utilize a Data Model that is built over some sales data.
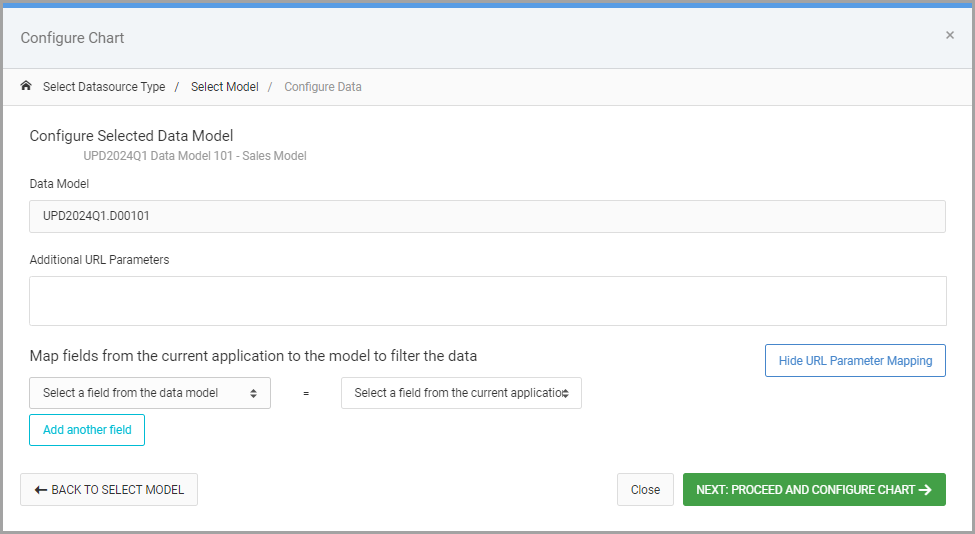
When selecting the data source, whether application or Data Model, developers may utilize the Configure Data screen to pass any additional parameters to filter the chart’s data set (as shown in Figure 7). Otherwise, just press the next button at the bottom right to proceed.
The Configure Chart screen, shown below in Figure 8 is where the chart specific options are configured.
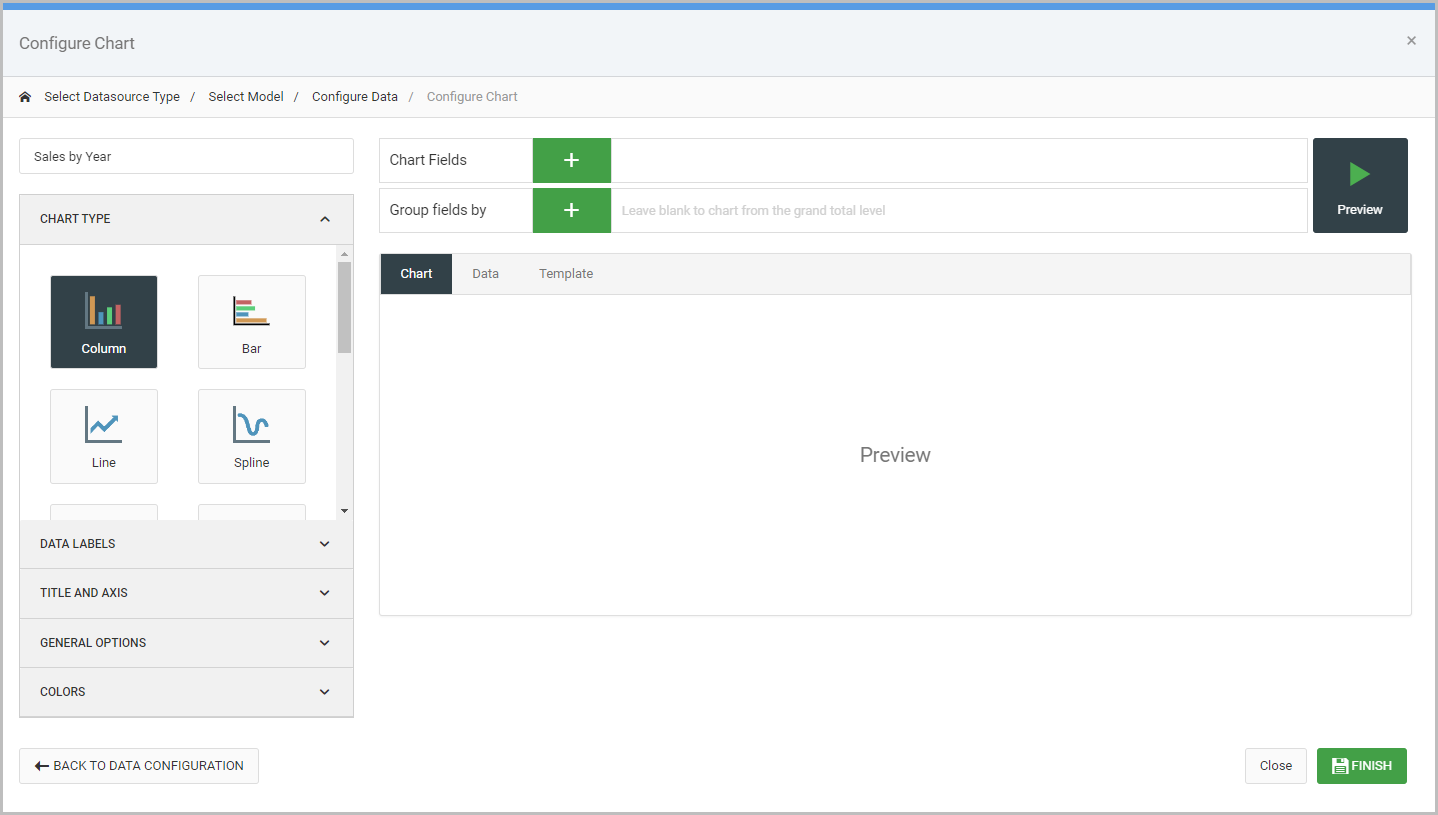
Chart Options
Various parts of the Configure Chart screen in Figure 8 will be discussed in further depth. Focusing on the left-most options include:
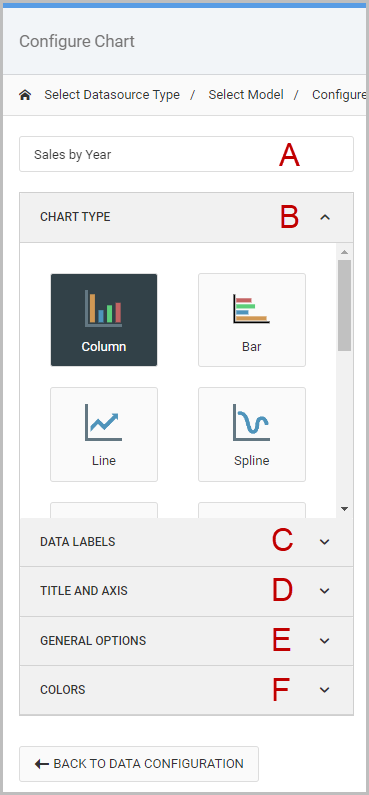
- A – Chart Title (required)
- Provide a name for the chart. The name will also serve as the title for the chart at runtime, if enabled in the Title and Axis section (D).
- B – Chart Type* (required)
- Select the chart output type (Bar, Pie, Line, etc.).
- C – Data Labels
- Options include the ability to show a legend on the chart and the ability to show the data values on the chart.
- D – Title and Axis
- Use to show a chart title at runtime, as well as control the text and boundaries of the x-axis and y-axis of the chart.
- E – General Options
- Set different sizing and margin options for the chart, as well as configure drilldown links. For developers wanting advanced customizations the graph template may be customized from here.
- F – Colors
- Set the theme and displayed colors associated with the chart output.
Chart Fields and Preview Pane
On the right-most side of the Configure Chart window, a developer will choose the Chart Fields and Group Fields for the chart, as shown in Figure 10.
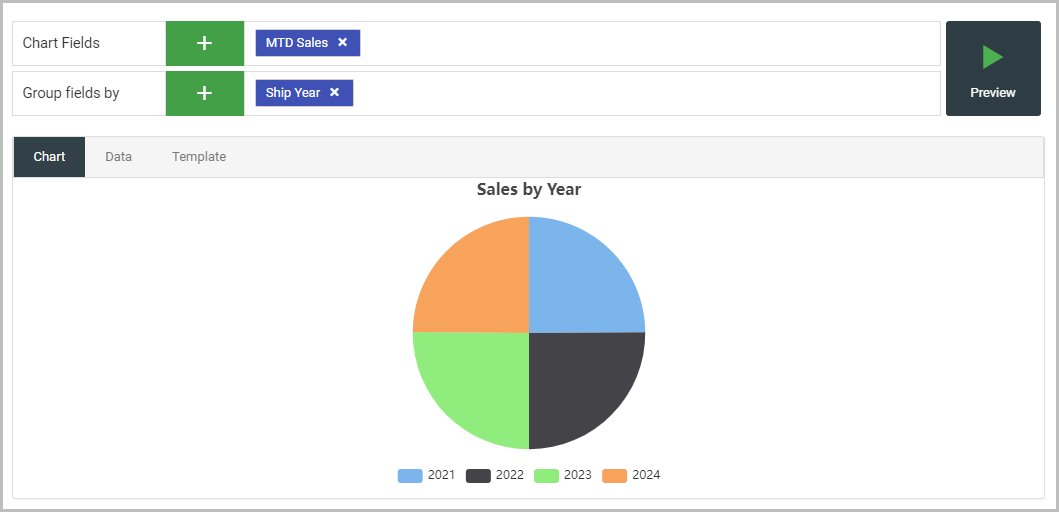
Chart Fields will typically be values such as sales, quantity, units, count, etc. and serve as the numeric values a developer is interested in totaling or displaying as a percentage in the chart output.
Group Fields on the other hand define how the data is grouped for the chart. Good examples include customer, year, quarter, product, ship date, etc.
After selecting the necessary fields, pressing the ‘Preview’ option will render a preview of the current chart that has been configured.
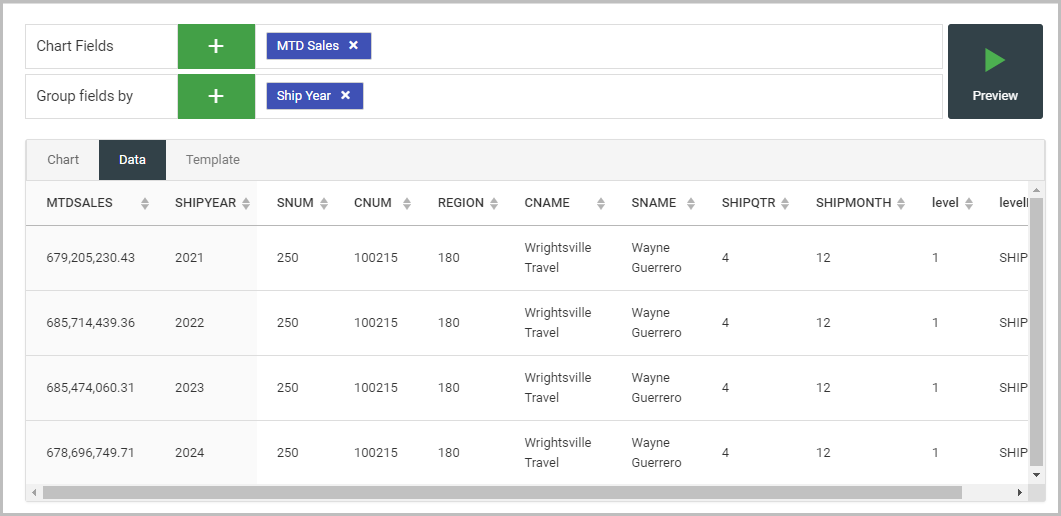
To examine the underlying data the chart is utilizing for the output, pressing the ‘Data’ tab (as shown in Figure 11) will display the queried data. The left-most columns are shaded with a grey-background to indicate their selection as a Chart Field or Group Field.
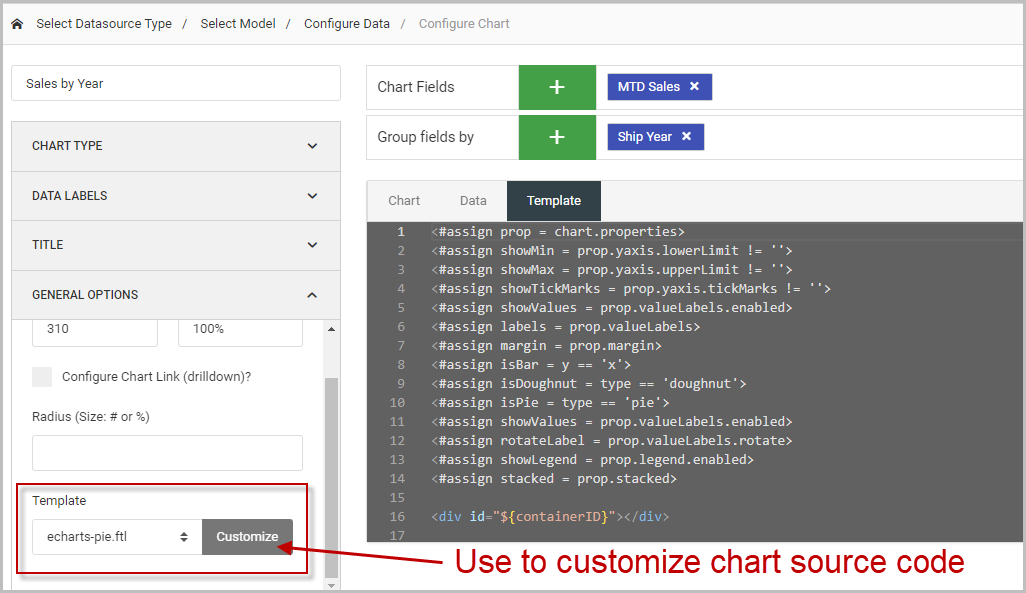
A developer may also view the chart template source code using the ‘Template’ option (Figure 12). The template source code is by default in a read-only mode, however the ability to edit the source directly is enabled by selecting the ‘Customize’ button in the General Options.
Once the appropriate configurations have been made, press the green ‘Finish’ button in the charting UI. If the chart is being inserted into an m-Power application, be sure to additionally save m-Painter.
Editing an existing chart
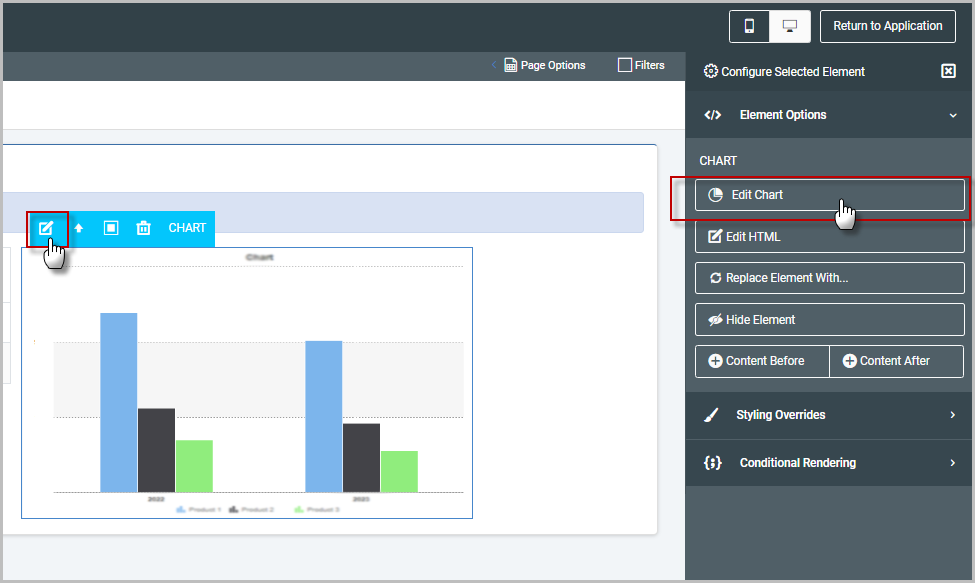
Charts in an m-Power application
Using Figure 13 as a reference, note that m-Painter will show the developer a stock image of a bar chart (as opposed to the actual selected chart type). To go edit the chart, simply click the ‘Edit’ option in the light-blue selected element menu or select ‘Edit Chart’ from the Element Options menu on the far-right side of m-Painter to bring up the charting UI.
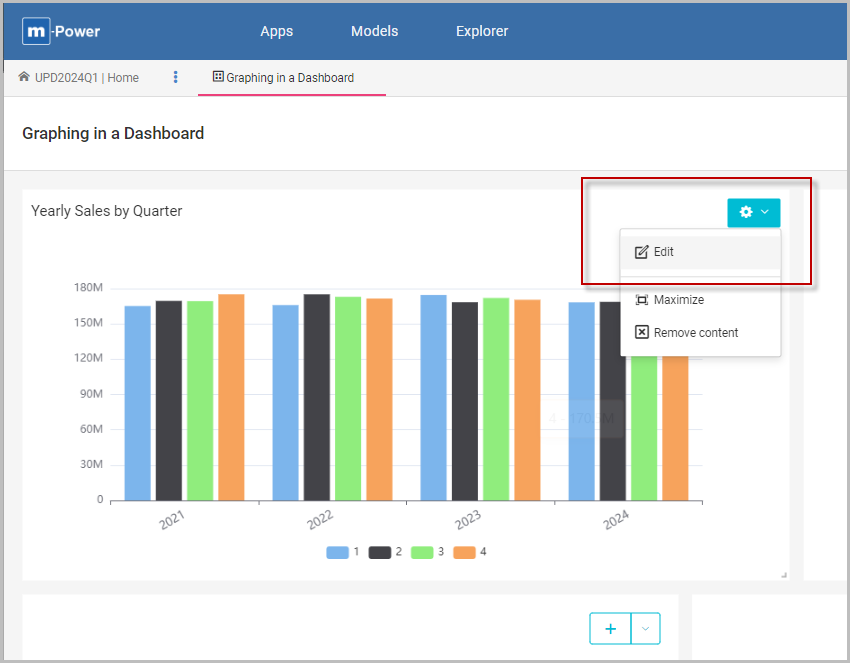
Charts in an m-Power dashboard
Using Figure 14 as a reference, click the gear icon on the portlet that contains the chart then press ‘Edit’ to bring up the charting UI.
Promoting to Production
To promote charts to production the underlying data source, whether an m-Power application or a Data Model, must be promoted to production.
If a custom graph template has been created, move over the appropriate .FTL file in …/m-power/mrcjava/mrcclasses/mrc-graph-templates/v2/custom to the same directory in production.