
This techblog post will discuss two options in regards to the layout and presentation of subtotal levels in the m-Power Regular Report template.
Subtotals Below (or Above) Details
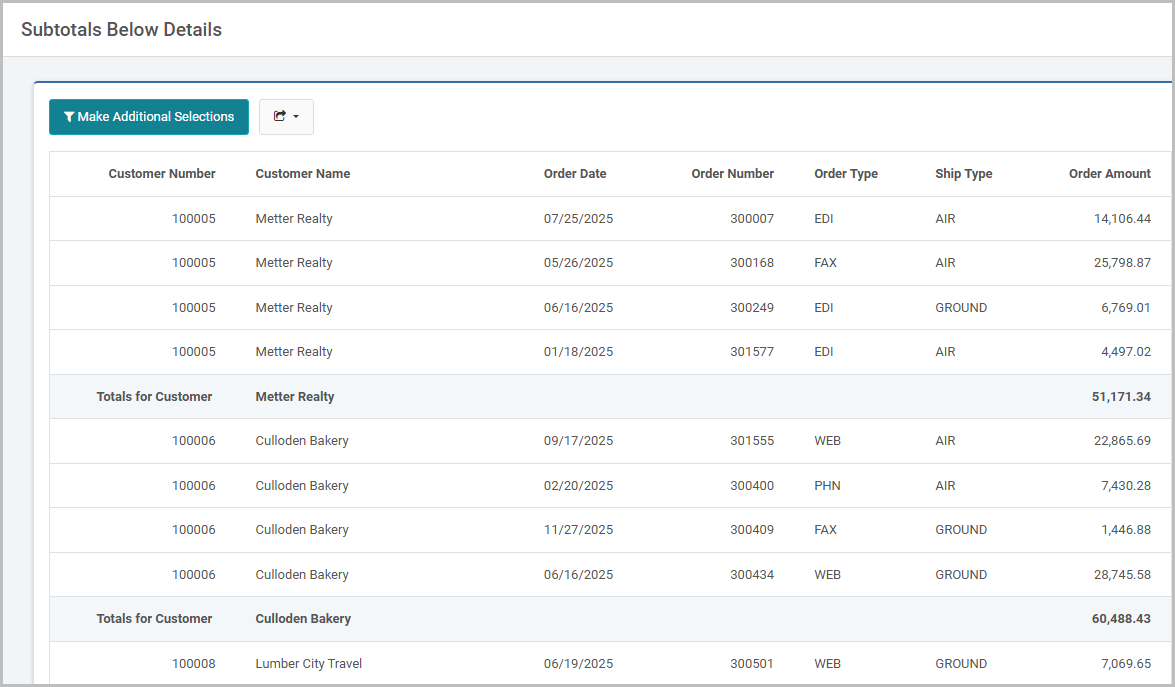
By default an m-Power Regular Report application will print the subtotal level(s) below the details, like so:
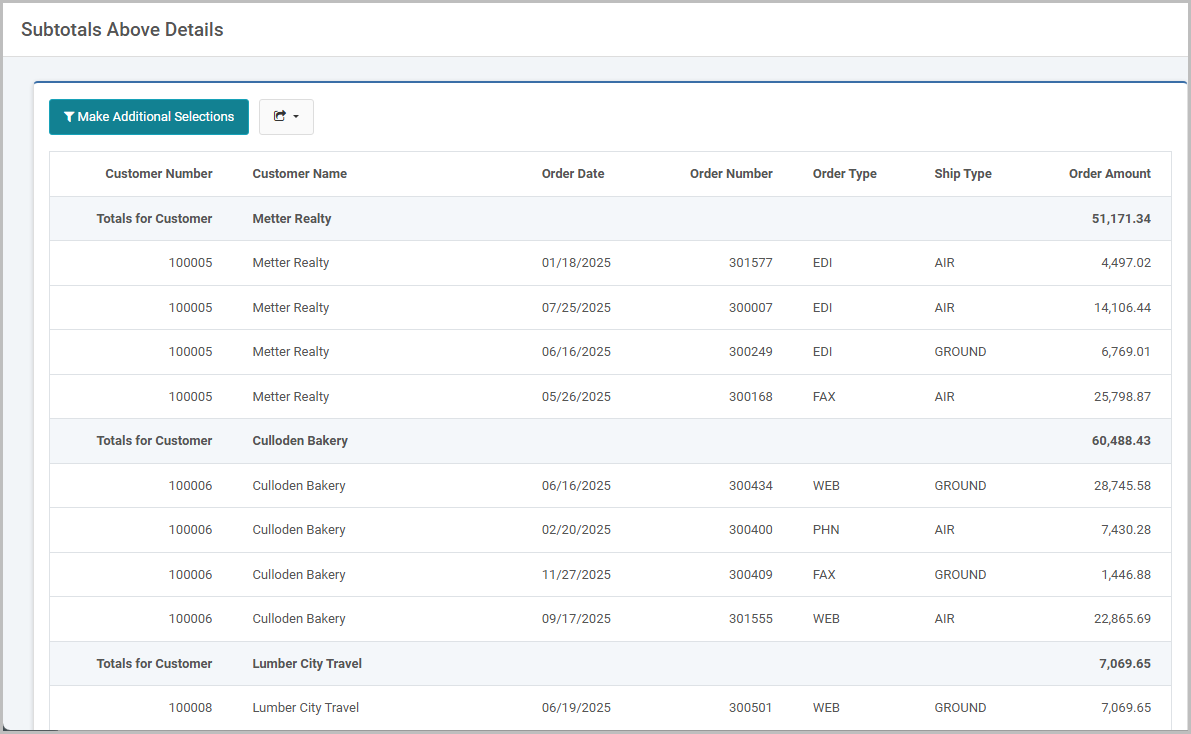
However if desired, the report can be set up with the subtotals above the details.
To control if the subtotals lines show above or below the details of the report, use the “Show Totals Below Details?” option in 2. Additional Options section of the report application:
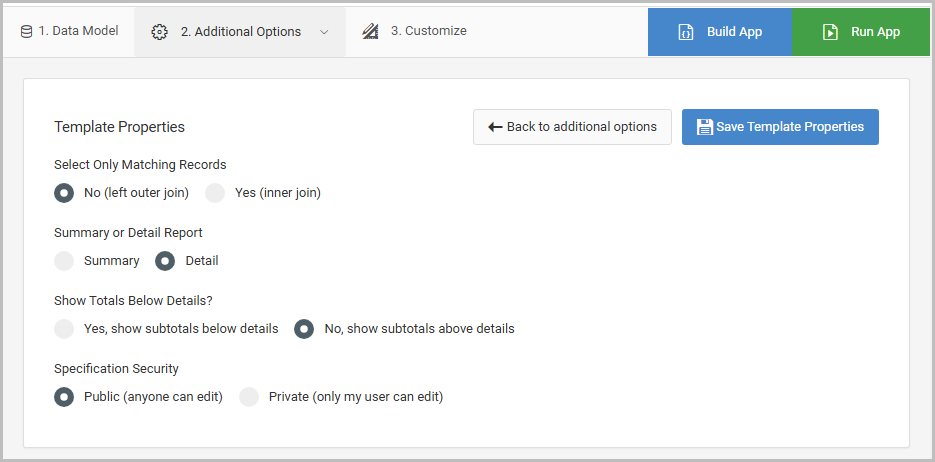
Upon changing this setting, press ‘Save Template Properties’. The developer must then build (or rebuild) the application.
Subtotal Header Row
To improve readability in reports, developers can insert a subtotal header above each grouping. This header provides a clear description of the grouped data, making it easier for users to understand the report structure at a glance.
To add a subtotal header row in m-Painter, follow these steps:
- Click anywhere inside the data table to show the Element Panel on the right side.
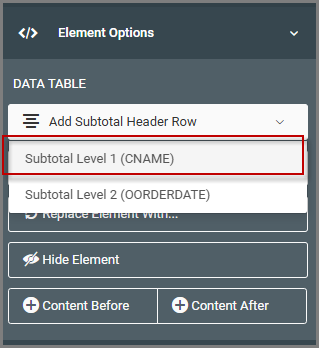
- In the Element Options section, click the “Select Data Table” button.
- Click the “Add Subtotal Header Row” button.
- Select the desired subtotal level to insert the header row.
Once added, the subtotal header row will appear at the top of the table. By default, the inserted row will include a text description specifying:
- The subtotal level number (Subtotal Level 1)
- The field being grouped by (Customer)
- The corresponding field value (${lastRow.CNAME})
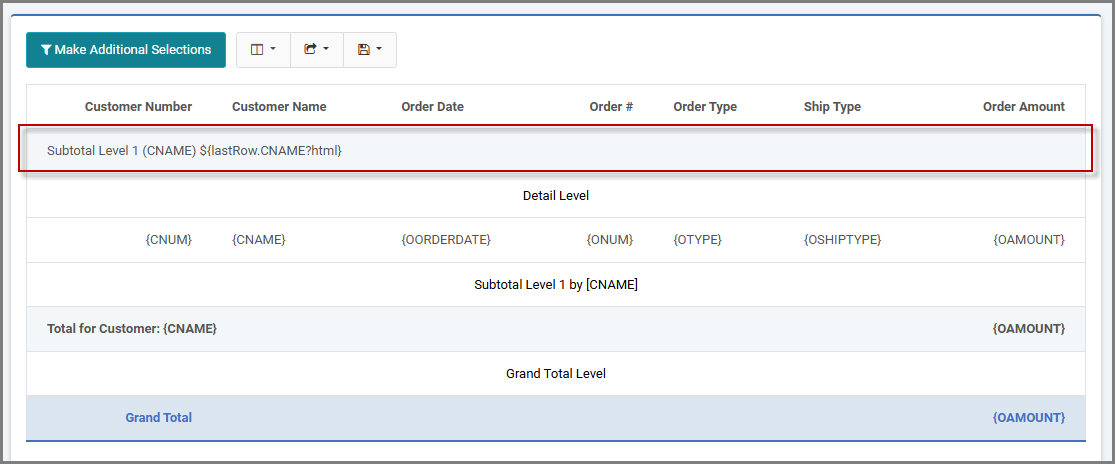
This default text can be customized using any standard m-Painter functions, allowing developers to modify/remove the wording, apply styling, or insert additional elements as needed.
At runtime, the header row will repeat as the first row of each respective subtotal grouping.
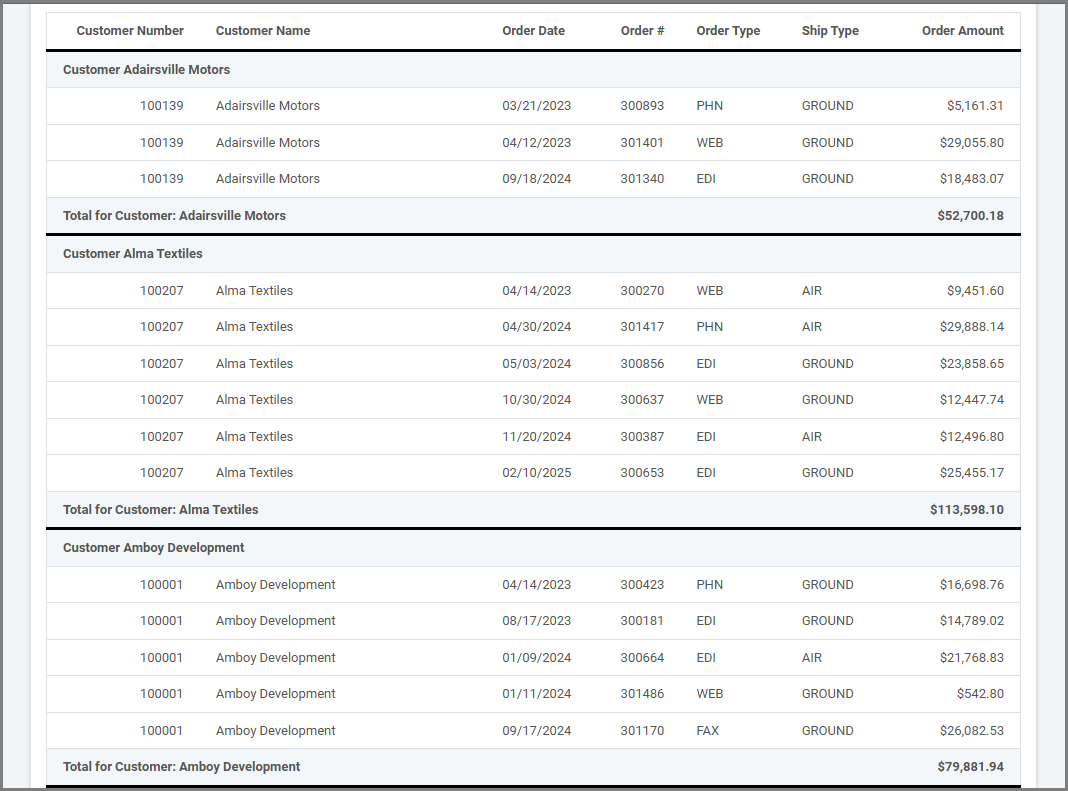
By leveraging this feature, developers can enhance report clarity and make grouped data more intuitive for end users.