These options, as shown below, are exclusive to the pie and doughnut chart types, and are explained in greater detail below.
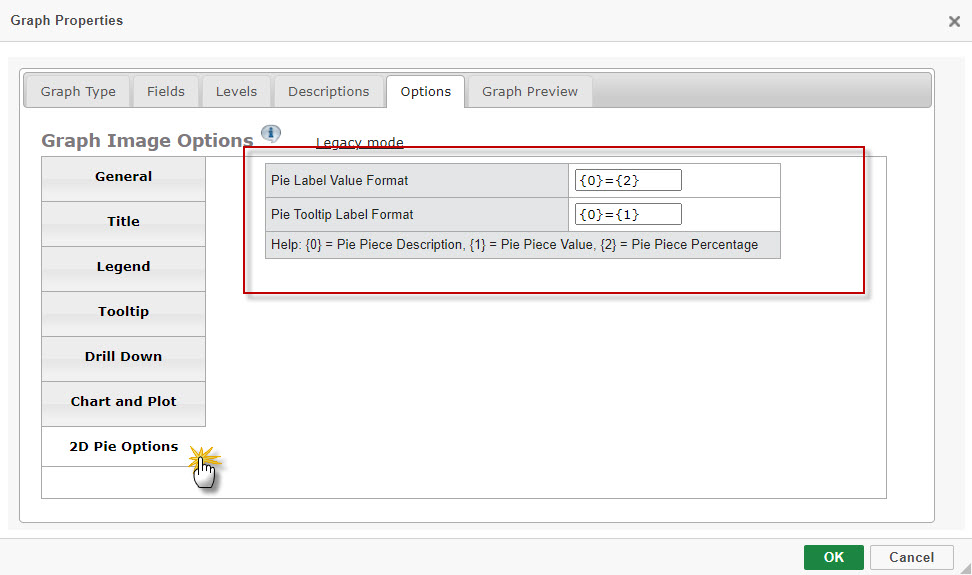
Pie Label Value Format
The Pie Label Value Format define what values are displayed on the label (red arrow).
There are three values that may be used in the format:
- the description from the description tab (displayed by entering “{0}”)
- the numeric value of the pie piece (displayed by entering “{1}”)
- that piece’s percentage of the pie (displayed by entering “{2}”).
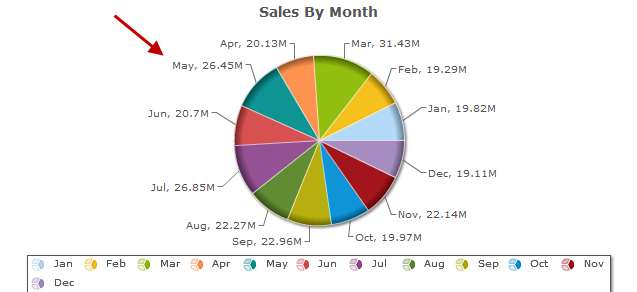
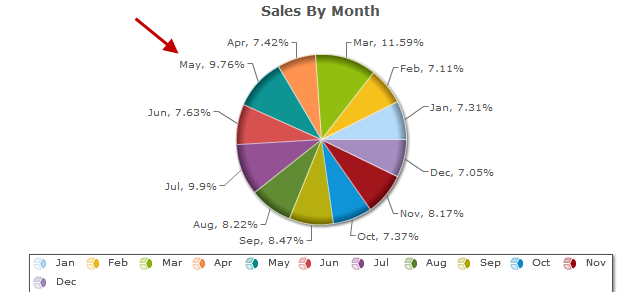
In the above example, the Pie Label Value Format is “{0}={1}”, while the below example is “{0)={2}”.
Pie Tooltip Label Format
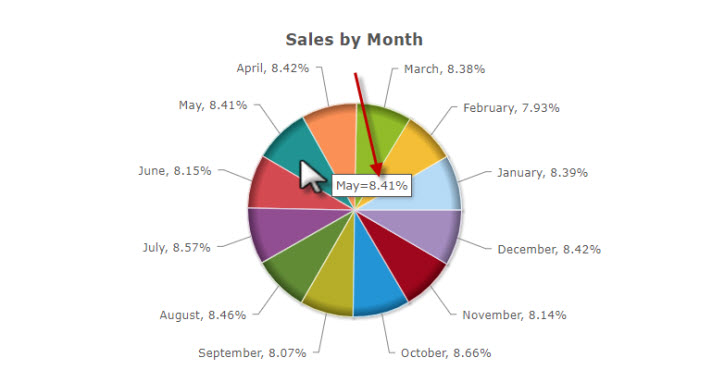
The Pie Tooltip Label Format defines what values are displayed when a pie piece is hovered on via a user’s cursor.
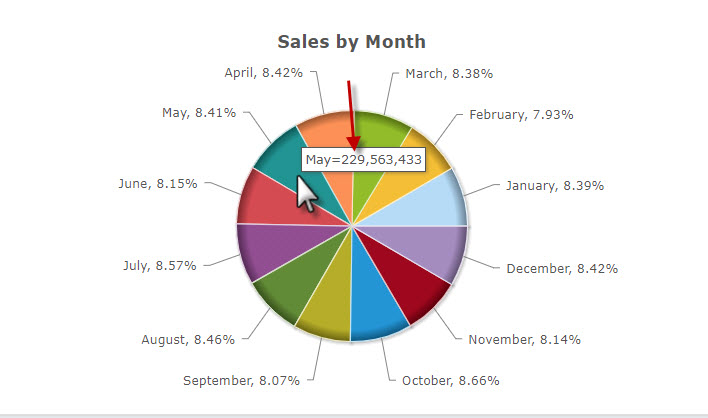
The applicable values for the Pie Tooltip Label are the same as the aforementioned Pie Label Value Format. In the above example, the Pie Tooltip Label Format is “{0}={1}”, while the below example is “{0}={2}”.