The m-Power Demo Video Series: How to create a custom BI/Reporting suite (with write-back and data warehousing)
The m-Power Demo Video Series takes you on a deep dive into m-Power's build process, walking you through a start-to-finish development project. In every video, we tackle a development project that would require days/weeks of manual coding, and complete the whole thing in under 2 hours.
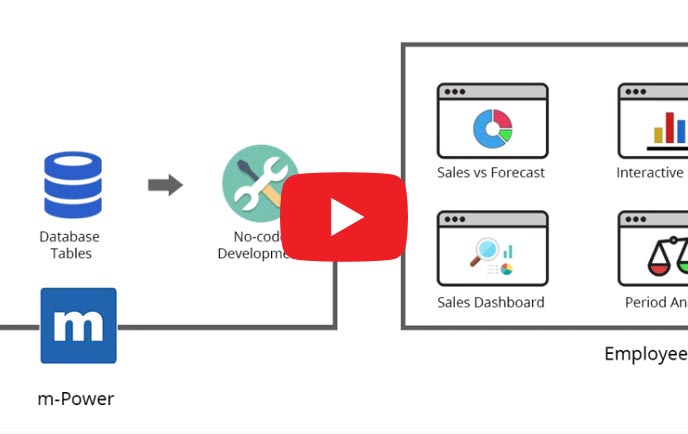
In this video, we walk you through a custom business intelligence/reporting project. We start with a single spreadsheet full of data and create a suite of BI & reporting applications that includes features like multi-tenant security, forecasting, dashboarding, data write-back, data warehousing, and many more. This video walks you through the project from start to finish, and explains each step along the way.
Don't have time to watch the whole video?
We've broken the video up into steps for those who don't have time to watch the whole thing from start to finish. You can filter the videos by topic and select one of the options below to view a specific step in the build process.
Filter videos by topic
Step-by-Step Videos
Part 1: Introduction
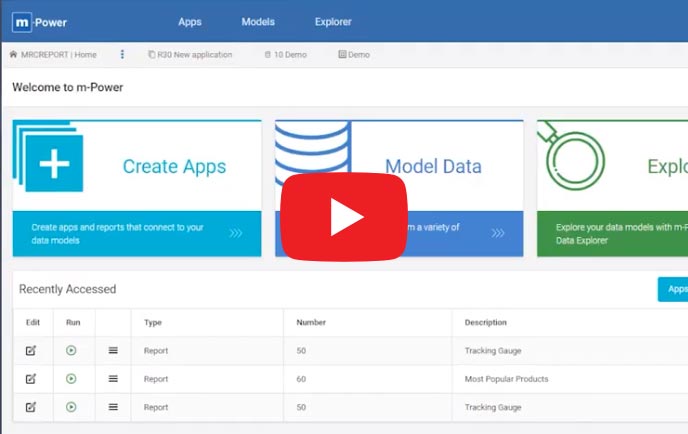
In part 1 of this video series, we introduce you to the m-Power Development Platform and explain the helpdesk portal we're about to create.
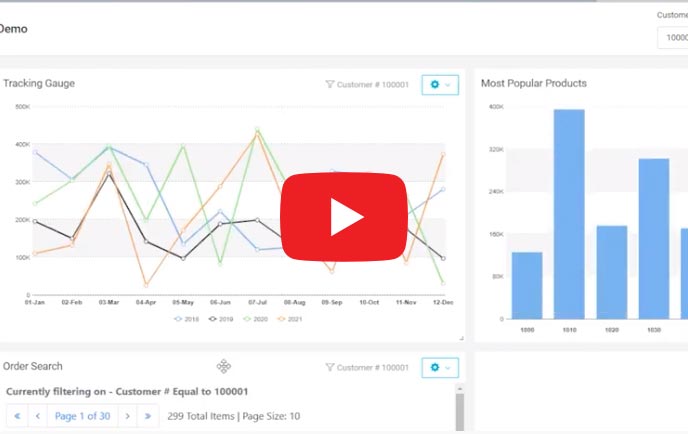
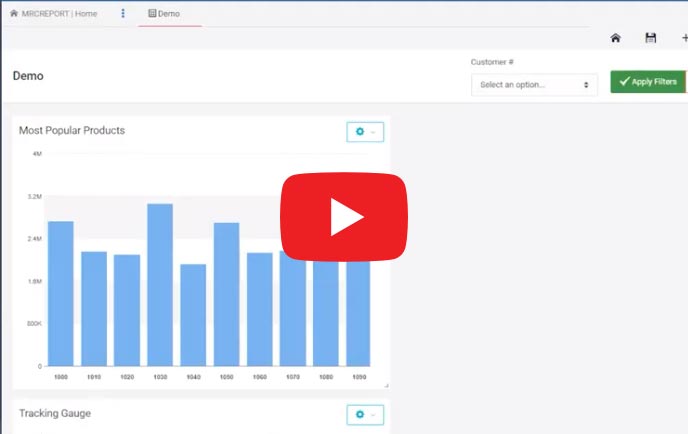
Part 2: Demo
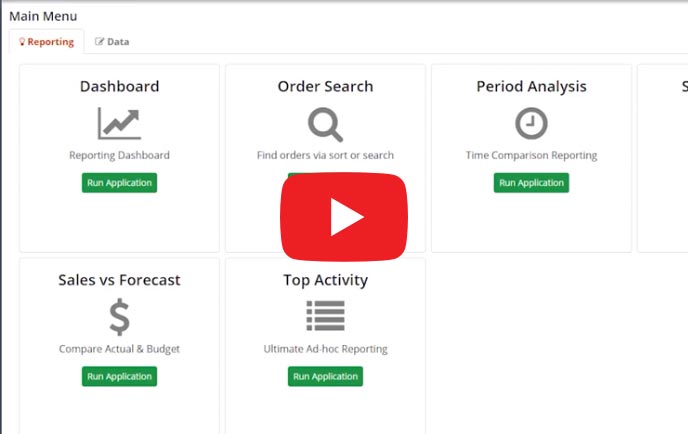
In part 2 of this video series, we walk you through the business intelligence and reporting applications we're going to create in the project.
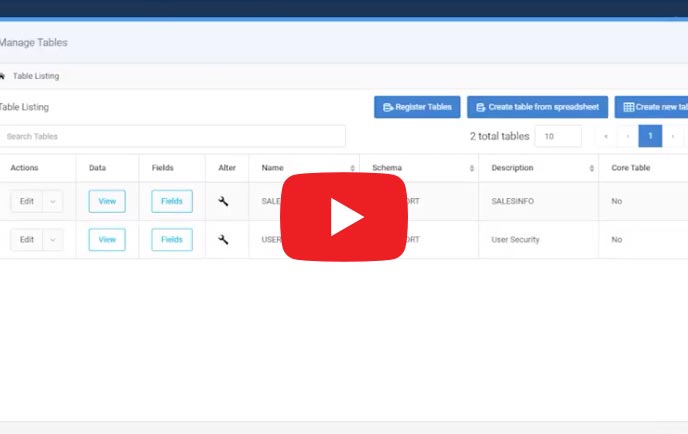
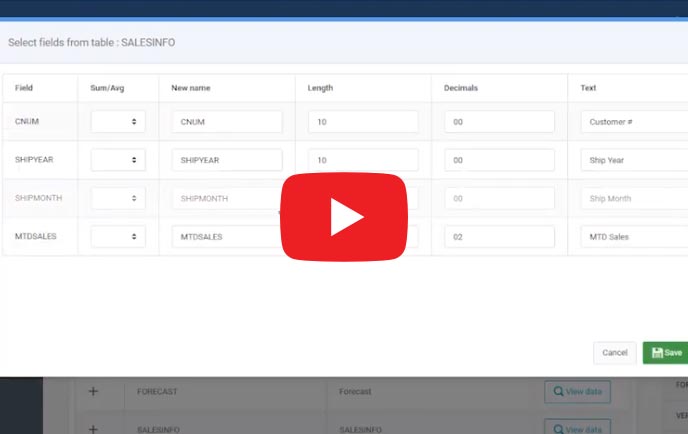
Part 3: Spreadsheet Upload
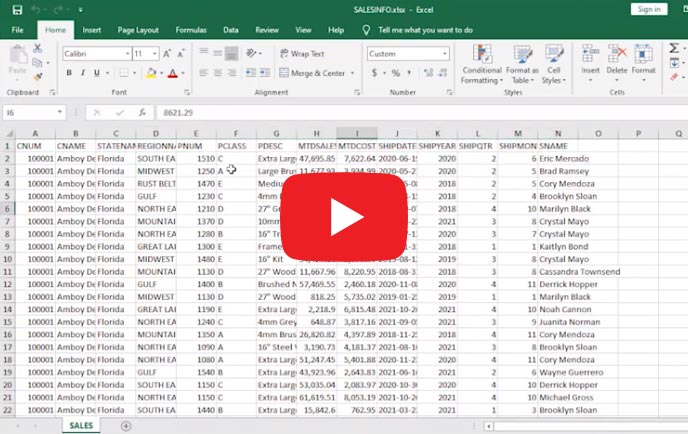
In part 3 of this video series, we upload a spreadsheet full of data into m-Power and turn it into a database table. In the rest of the series, we'll be building a suite of applications over this data.
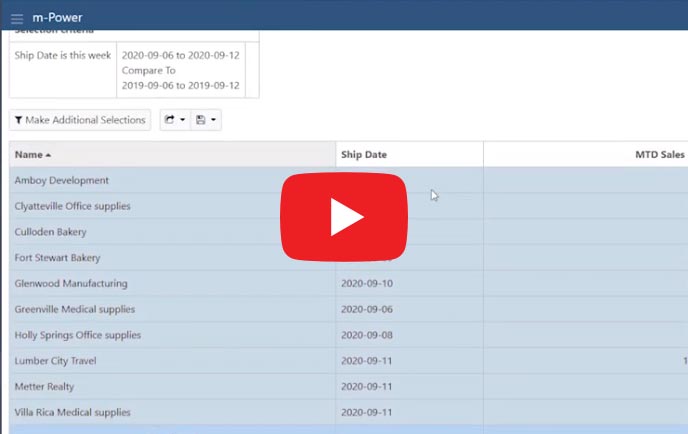
Part 4: Building the order search application
In part 4 of this video series, we build our first application over our new database table. This application displays order data and lets users sort, search, and filter through that data.
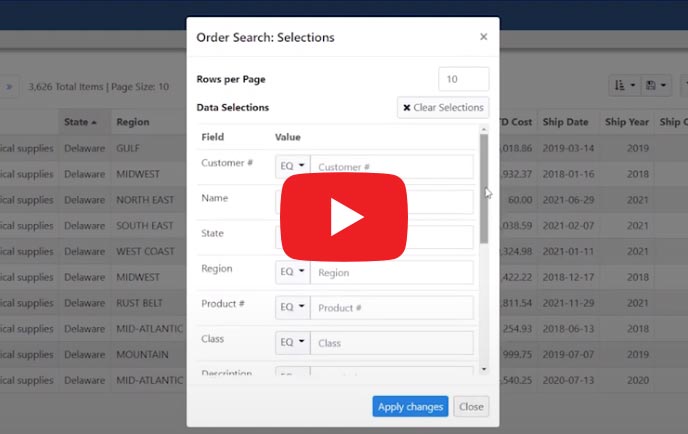
Part 5: Customizing the order search application
In part 5 of this video series, we customize the application we just created. We add a customer dropdown list and features that let users reorder columns and export data to Excel.
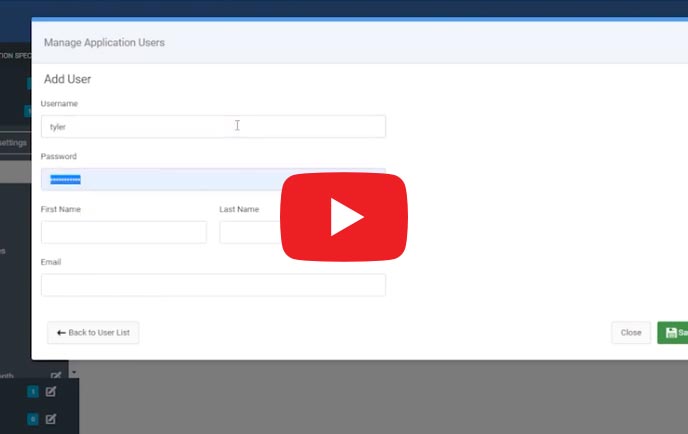
Part 6: Application Security
In part 6 of this video series, we add user security to the application. This places the application behind a login screen, and limits application access to specific users.
Part 7: Multi-tenant Security
In part 7 of this video series, add multi-tenant security to the application. This secures the application at the row level, meaning different users can access the same application yet only see the data they're authorized to view.
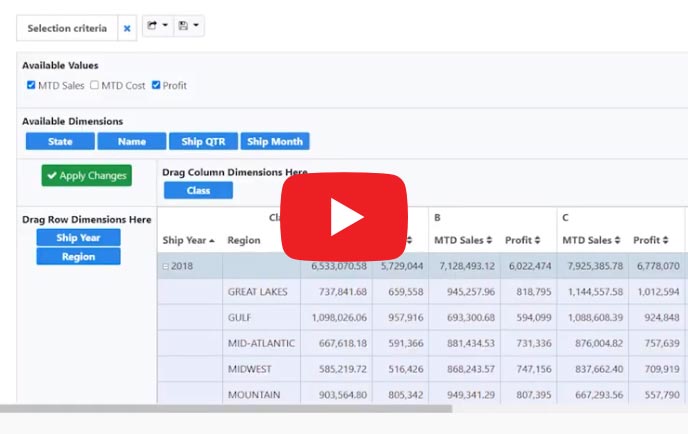
Part 8: Creating the Pivot Table
In part 8 of this video series, we create a web-based pivot table report over our data. The pivot table lets our users filter, sort, and analyze data from many different angles.
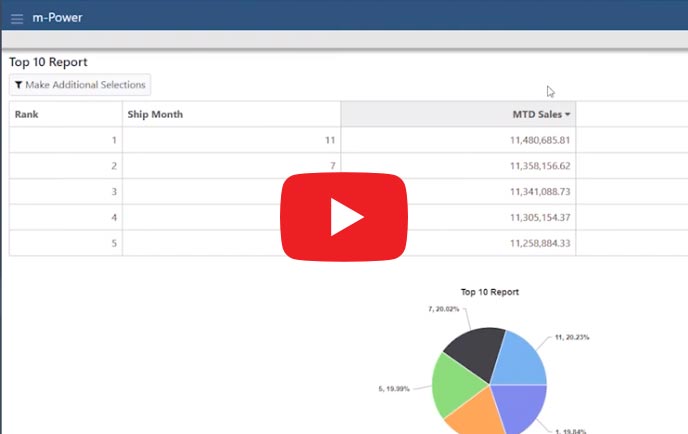
Part 9: The Ranking Report
In part 9 of this video series, we create a ranking report over our data. The ranking report lets users generate top/bottom lists over any aspect of their data.
Part 10: The Application Menu
In part 10 of this video series, we create a menu for our applications. The menu provides our users with a simple way to access all of the applications we're creating.
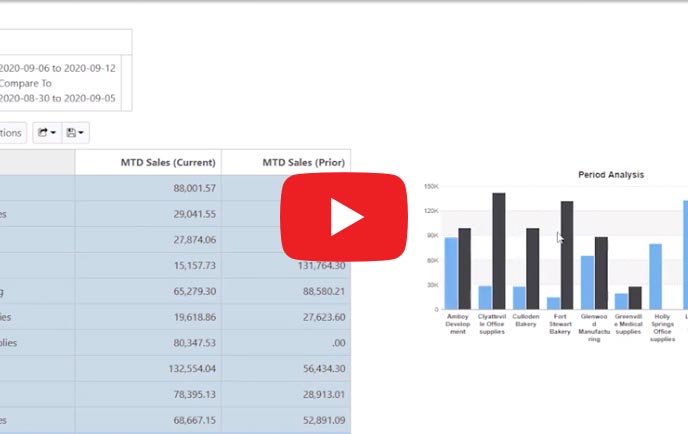
Part 11: The Period Analysis Application
In part 11 of this video series, we create the period analysis application over our data. The period analysis application lets users compare data across date ranges. For instance, it's often used to compare monthly performance vs. the same month in the prior year.
Part 12: Making a Responsive Graph
In part 12 of this video series, we customize the graph in our period analysis application. We'll customize the look/feel and make the graph responsive, so it adapts to any screen size.
Part 13: Building the Dashboard
In part 13 of this video series, we create a business dashboard with m-Power. We'll take charts and tables from other applications we've already created and combine them into a dashboard.
Part 14: Adding a Dropdown List
In part 14 of this video series, we add a dropdown list to our dashboard. This dropdown list lets users easily filter the dashboard data by individual customers.
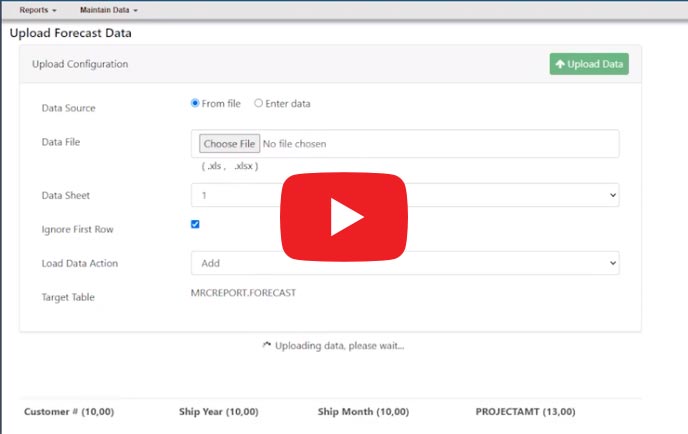
Part 15: Building the Data Upload Application
In part 15 of this video series, we create a data upload application. The data upload application lets users upload forecast data to the database so it can be used in the forecasting application.
Part 16: Building the Data Warehouse
In part 16 of this video series, we create a data warehouse for our forecasting application. We need this data warehouse because the data we're comparing in the application is formatted differently. The data warehouse object takes data from one table and summarizes it into a like format.
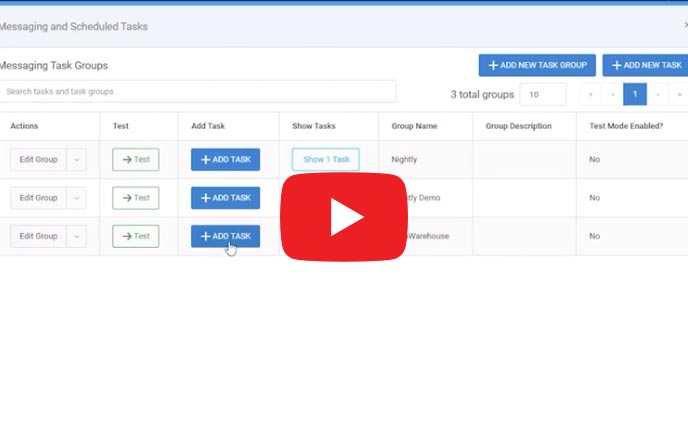
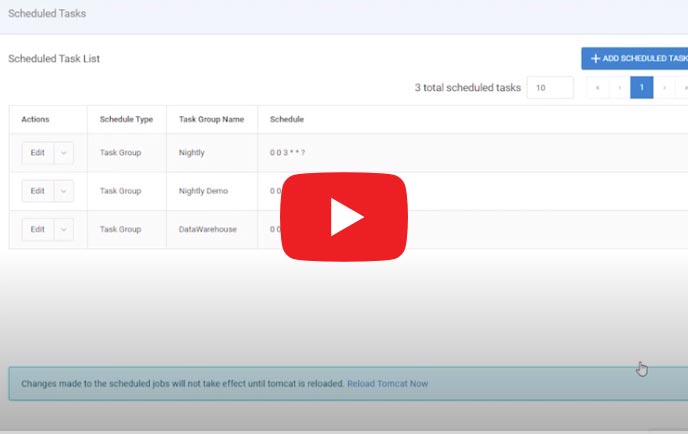
Part 17: Automating the Data Warehouse
In part 17 of this video series, we automate the data warehouse that we created in the last video. This automation will run on a nightly basis and update our data warehouse with new data.
Part 18: Loading the Month Table
In part 18 of this video series, we load a month table to our project. We'll use this table to convert numeric months into text within our applications.
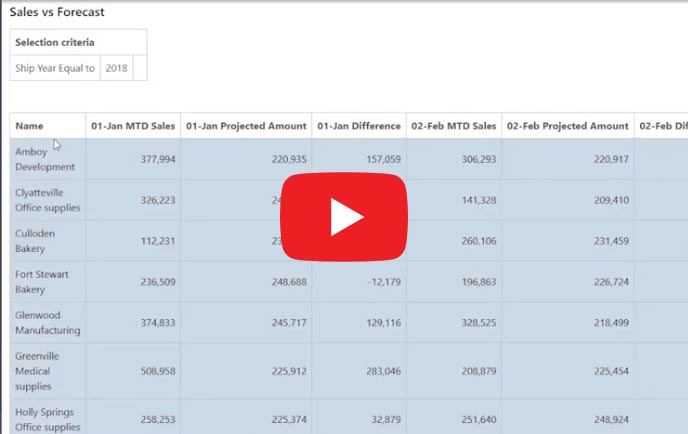
Part 19: Sales Forecasting Application Development
In part 19 of this video series, we create the sales forecasting application. This application lets users easily compare sales data with forecast data and gauge performance vs. expected performance.
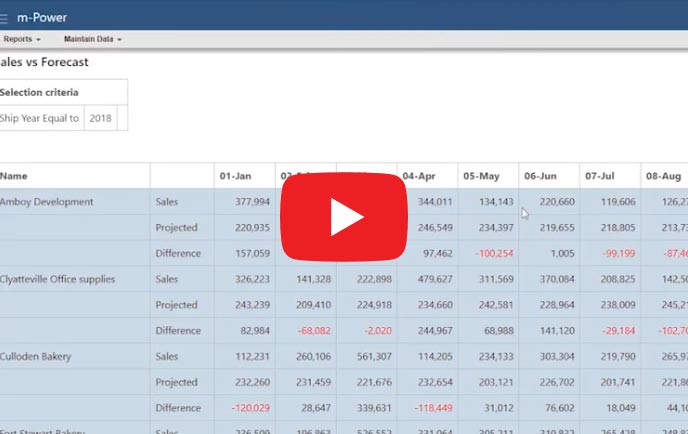
Part 20: Customizing the Forecast Application
In part 20 of this video series, we customize the sales vs. forecasting application that we just created. We'll use m-Power's visual editor - m-Painter - to update the look/feel of our application and add color coding.
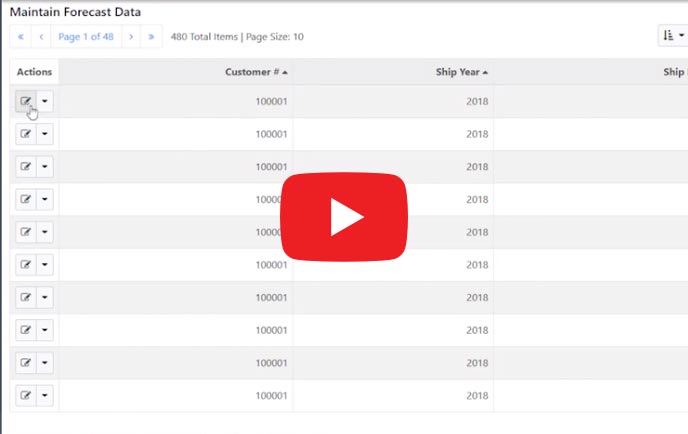
Part 21: Building a Write-Back Application
In part 21 of this video series, we create an application to maintain forecast data. This application offers database write-back capabilities, and lets users update forecast data in the database. In the rest of the series, we'll be building a suite of applications over this data.
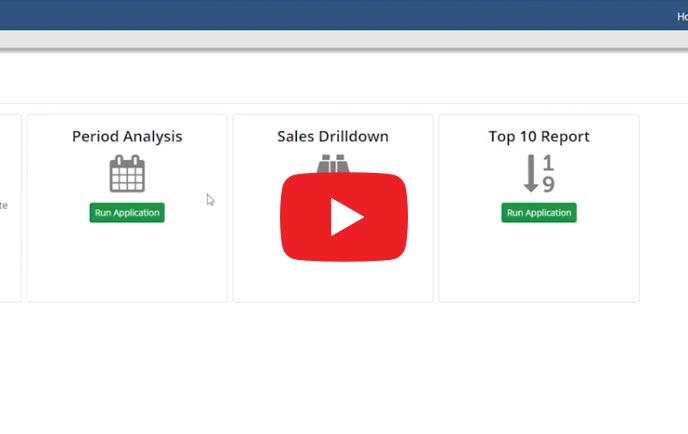
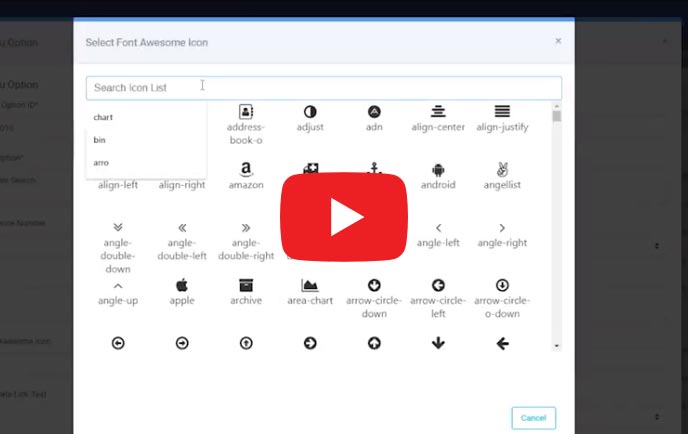
Part 22: Customizing the Application Menu
In part 22 of this video series, we customize the application menu that we created in part 10. We'll change the menu from a text-based layout to a more graphical, card-based layout.